Push Insights Notifications to OCI Monitoring
The ML Insights Test or Test Suites component lets users configure test cases that check if the metric results produced during Profile computation breach a particular threshold. Any detected threshold breaches are notified to a user in a way that is easy to visualize and track. ML Insights provides a Notification feature to push threshold breaches configured using Test or Test Suites to the OCI Monitoring service.
Users can be notified using the OCI Monitoring service of model performance and data quality issues, enabling them to take appropriate actions for remediation. Also, users can set up alarms and dashboards for receiving breach notifications and visualizing the breaches using OCI Monitoring.
Prerequisites
Since users are notified on threshold breaches, these thresholds have to be configured using the Insights Test or Test Suites component (either using the Builder API or the Config Reader). The Insights Test Results that are produced after these tests are used as the basis for Notifications.
To push test results to OCI Monitoring, appropriate IAM policies should be configured as described here: https://docs.oracle.com/en-us/iaas/Content/Security/Reference/monitoring_security.htm#iam-policies.
High-level Overview
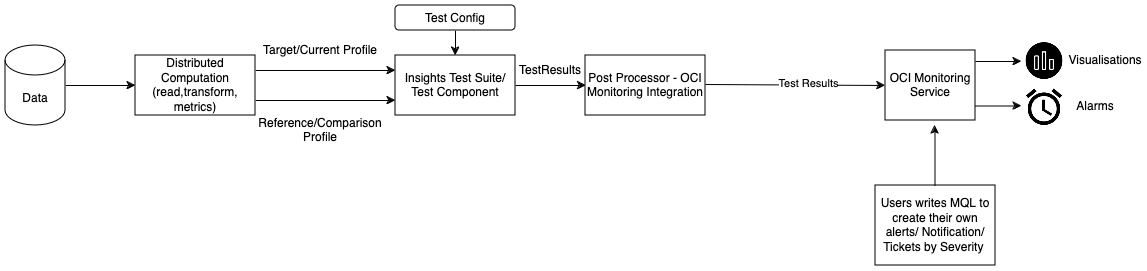
User configures Insights Builder or Insights Config Reader to compute profile(s) and run tests:
The Metrics component and the TestConfig component are needed to runs tests on selected metrics.
Also, a post-processor called OCIMonitoringPostProcessor is configured, with details like compartment_id, namespace and dimensions to be used while configuring OCI Monitoring. This component sends the results of tests run on metrics to OCI Monitoring.
After a successful run of ML Insights, you can verify that the test run results have been pushed to OCI Monitoring from the OCI Console. The test result values can be visualized using graphs or charts, and filtered using dimensions that were set while configuring the post-processor component.
You can configure alarms on these test result values, with the help of simple MQL queries to set details on notifications.
Configure ML Insights to Push Notifications to OCI Monitoring
This section covers the steps necessary to configure ML Insights to run tests on selected model metrics, push the Insights Test Results to OCI Monitoring, and get notified whenever a threshold set for a particular test has been breached.
Sample Configuration File
In the config file, an additional post-processor called OCIMonitoringPostProcessor is specified, which pushes the Insights Test Results to the OCI Monitoring service.
ml-insights-config.json
{
  "input_schema": {
    "Age": {
      "data_type": "integer",
      "variable_type": "continuous",
      "column_type": "input"
    },
    "EnvironmentSatisfaction": {
      "data_type": "integer",
      "variable_type": "continuous",
      "column_type": "input"
    },
    "CreatedDate": {
      "data_type": "datetime",
      "variable_type": "datetime",
      "column_type": "input"
    },
    "ModeOfTransport": {
      "data_type": "string",
      "variable_type": "nominal",
      "column_type": "input"
    }
  },
  "engine_detail": {
    "engine_name": "native"
  },
  "reader": {
    "type": "JsonlNativeDataReader",
    "params": {
      "url_path": "oci://<bucket>/*.jsonl",
      "orient": "records",
      "lines": "True"
    }
  },
  "reference_profile_reader": {
    "type": "OCIObjectStorageProfileReader",
    "params": {
      "path": "oci://bucket@namespace/object_prefix/reference_profile.bin"
    }
  },
  "dataset_metrics": [
    {
      "type": "RowCount"
    },
    {
      "type": "CorrelationRatio"
    }
  ],
  "feature_metrics": {
    "Age": [
      {
        "type": "Min"
      },
      {
        "type": "Max"
      },
      {
        "type": "Count"
      }
    ],
    "EnvironmentSatisfaction": [
      {
        "type": "Mode"
      },
      {
        "type": "Count"
      }
    ],
    "CreatedDate": [
      {
        "type": "DateTimeMin"
      }
    ]
  },
  "transformers": [
    {
      "type": "ConditionalFeatureTransformer",
      "params": {
        "conditional_features": [
          {
            "feature_name": "Young",
            "data_type": "integer",
            "variable_type": "ordinal",
            "expression": "df.Age < 30"
          }
        ]
      }
    }
  ],
  "post_processors": [
    {
      "type": "ObjectStorageWriterPostProcessor",
      "params" : {
        "bucket_name": "test-bucket",
        "object_name": "config.json",
        "prefix": "mlinsights"
      }
    },
    {
      "type": "LocalWriterPostProcessor",
      "params" : {
        "file_name": "config.json" ,
        "file_location": "data"
      }
    },
    {
      "type": "OCIMonitoringPostProcessor",
      "params" : {
        "compartment_id": "compartment_id",
        "namespace": "namespace",
        "dimensions": {
          "monitor_id": "monitor_id"
        }
      }
    }
  ],
  "tags": {
    "tag": "value"
  },
  "test_config": {
    "feature_metric_tests": [
      {
        "feature_name": "Age",
        "tests": [
          {
            "test_name": "TestGreaterThan",
            "metric_key": "Min",
            "threshold_value": 5,
            "tags": {
              "key_1": "value_1"
            }
          },
          {
            "test_name": "TestIsComplete"
          }
        ]
      }
    ],
    "dataset_metric_tests": [
      {
        "test_name": "TestGreaterThan",
        "metric_key": "RowCount",
        "threshold_value": 40,
        "tags": {
          "subtype": "falls-xgb"
        }
      }
    ]
  }
}
Compute Insights Profile and Test Results
Begin by loading the required libraries and modules:
from mlm_insights.config_reader.insights_config_reader import InsightsConfigReader
Initialize the Insights builder by specifying the location of the monitor config JSON file (under config_location).
insights_builder = InsightsConfigReader(config_location="ml-insights-config.json").get_builder()
Run this builder object to get the run result, which yields the Profile and Test Results.
run_result = insights_builder.build().run()
profile = run_result.profile
test_results = run_result.test_results
The test_results object generated as part of the builder run is pushed to OCI Monitoring by the relevant post-processor.
Configure OCI Monitoring Service in OCI Console
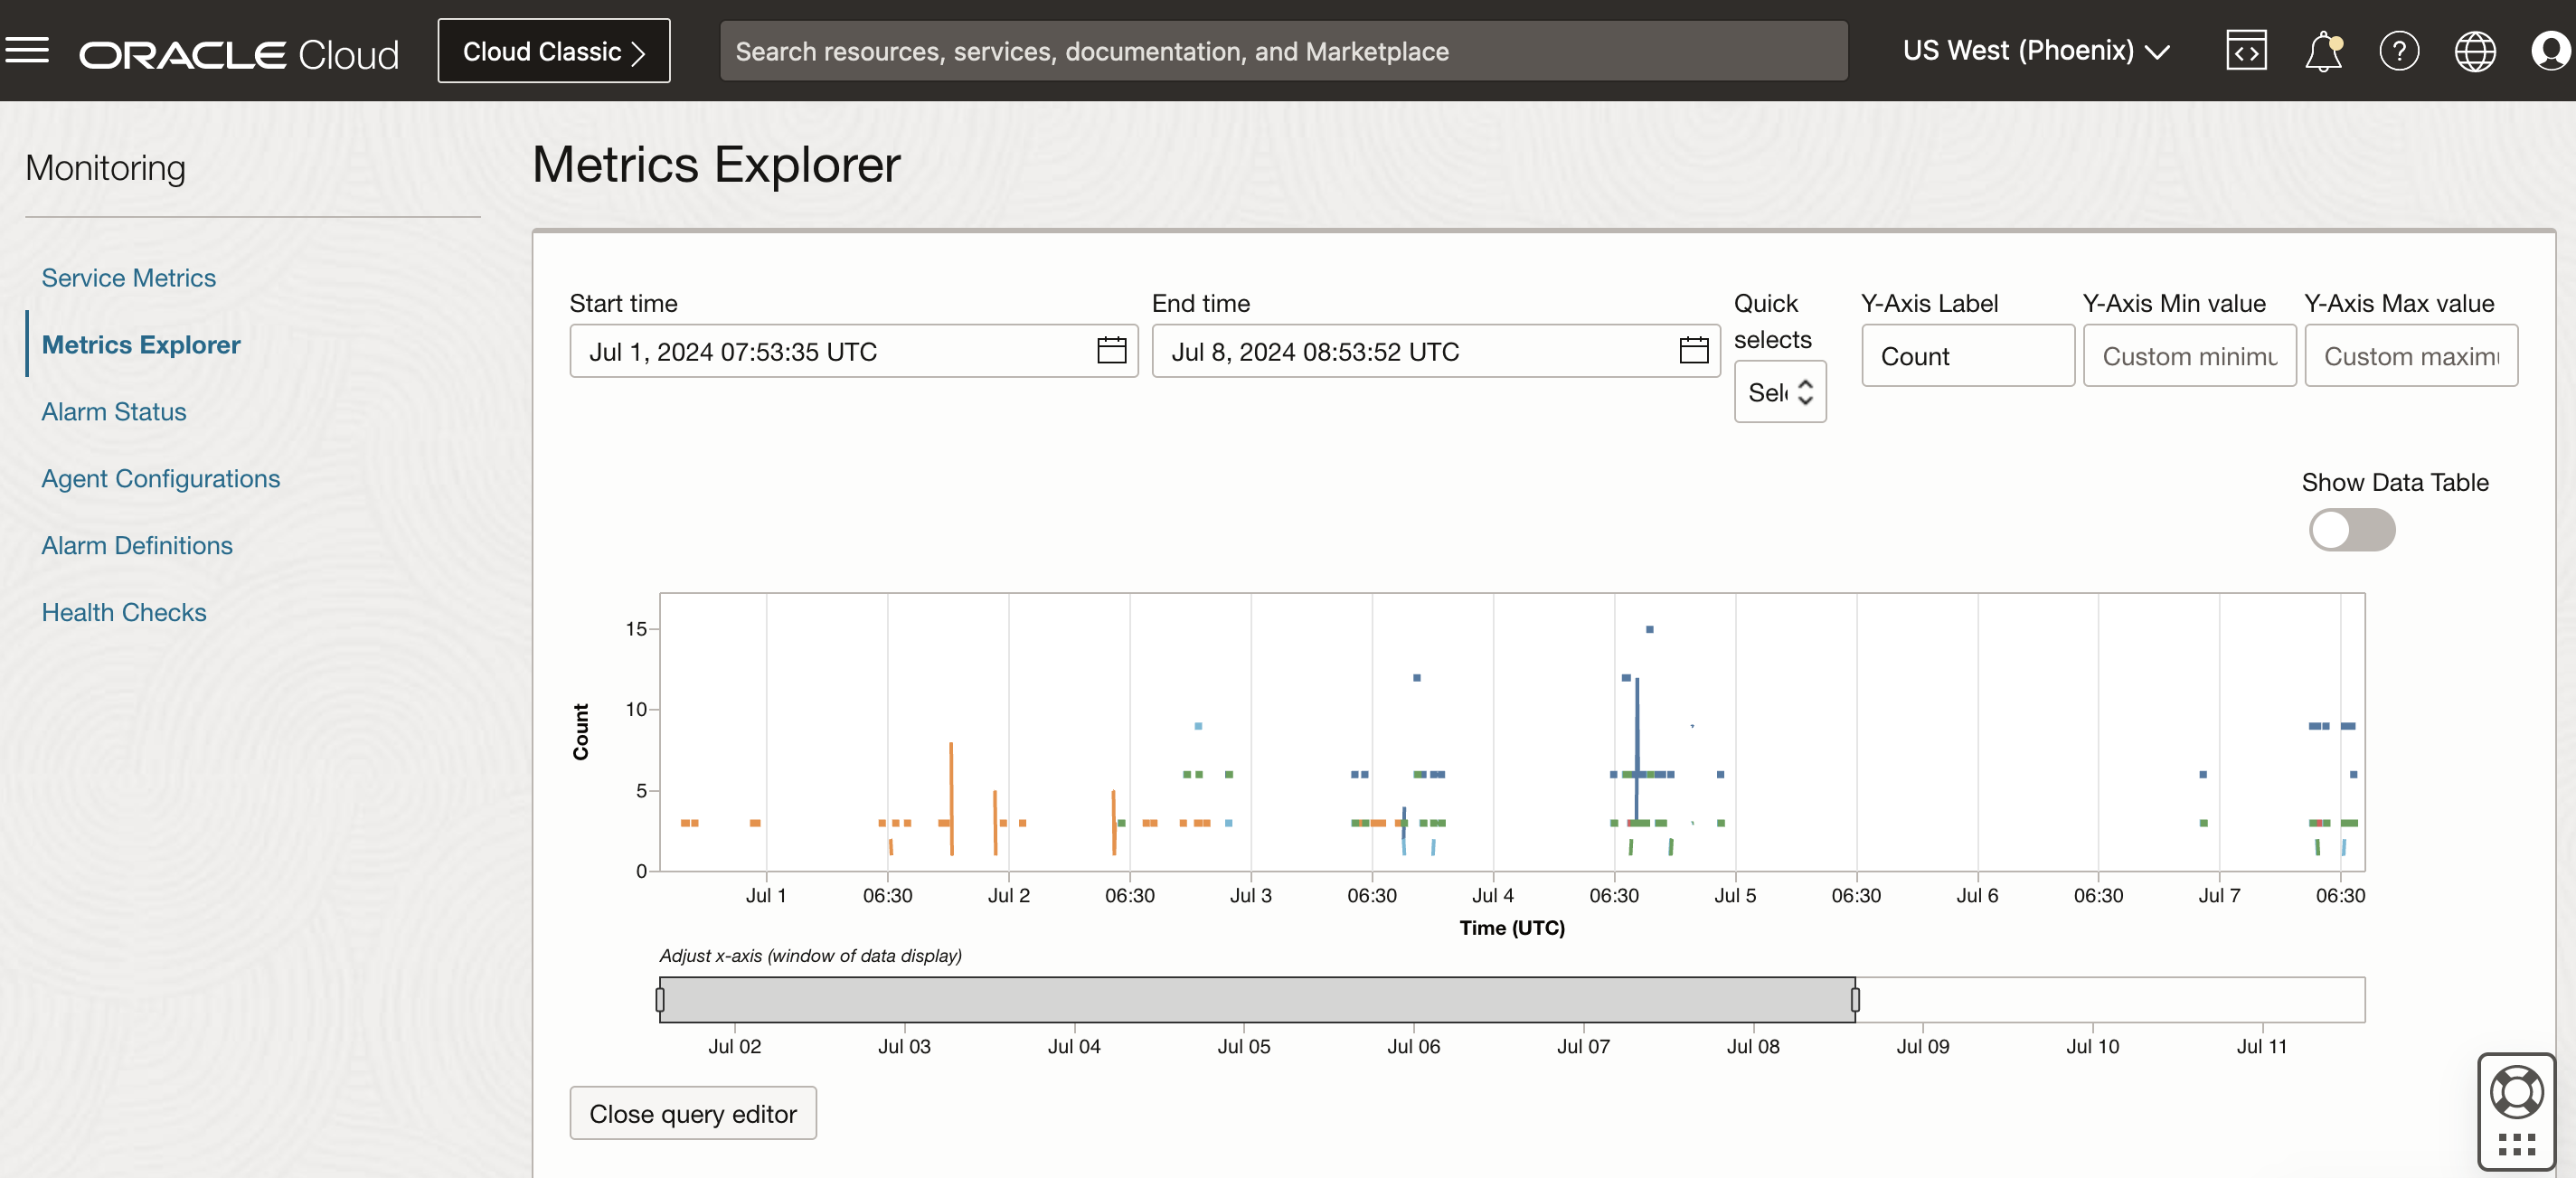
Under the Observability & Management section in the OCI Console sidebar menu, select Metrics Explorer under the Monitoring subsection.
The metrics sent to OCI monitoring can be visualized by specifying the same parameters that were specified while configuring the OCIMonitoringPostProcessor. Details on configuring the OCIMonitoringPostProcessor are documented here: OCIMonitoringPostProcessor
Compartment: This is the compartment name corresponding to the OCI compartment ID specified via the compartment_id parameter
Metric namespace: This field corresponds to the namespace parameter
Metric name: This refers to the specific test name on which run results can be visualized (for example, TestGreaterThan or TestIsPositive). This test name has to be configured in the test config while running the Insights library.
Interval/Statistic: These fields can be set based on user preference to visualize run results or configure alarms
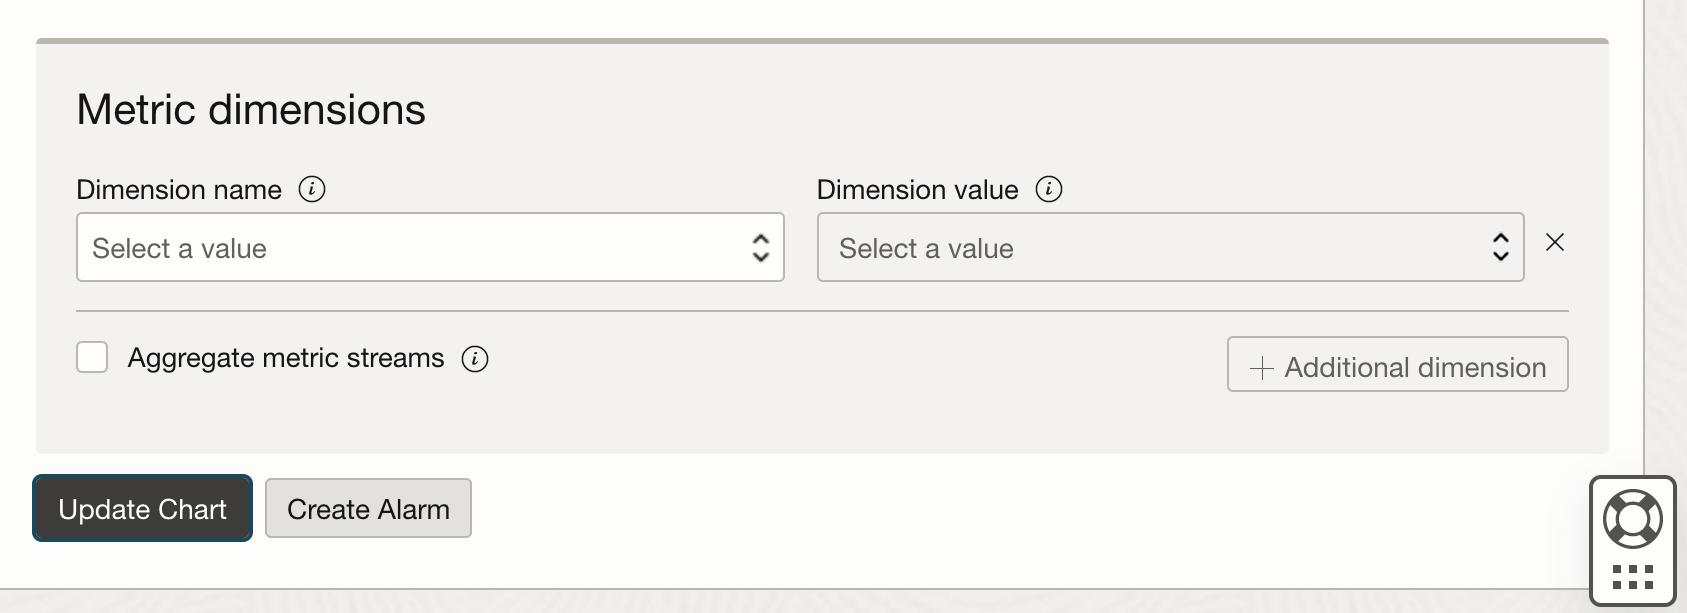
Metric dimensions: This field enables the user to filter run results using any of the keys specified via the dimensions parameter. Default dimensions passed by the OCIMonitoringPostProcessor are enumerated here: OCIMonitoringPostProcessor
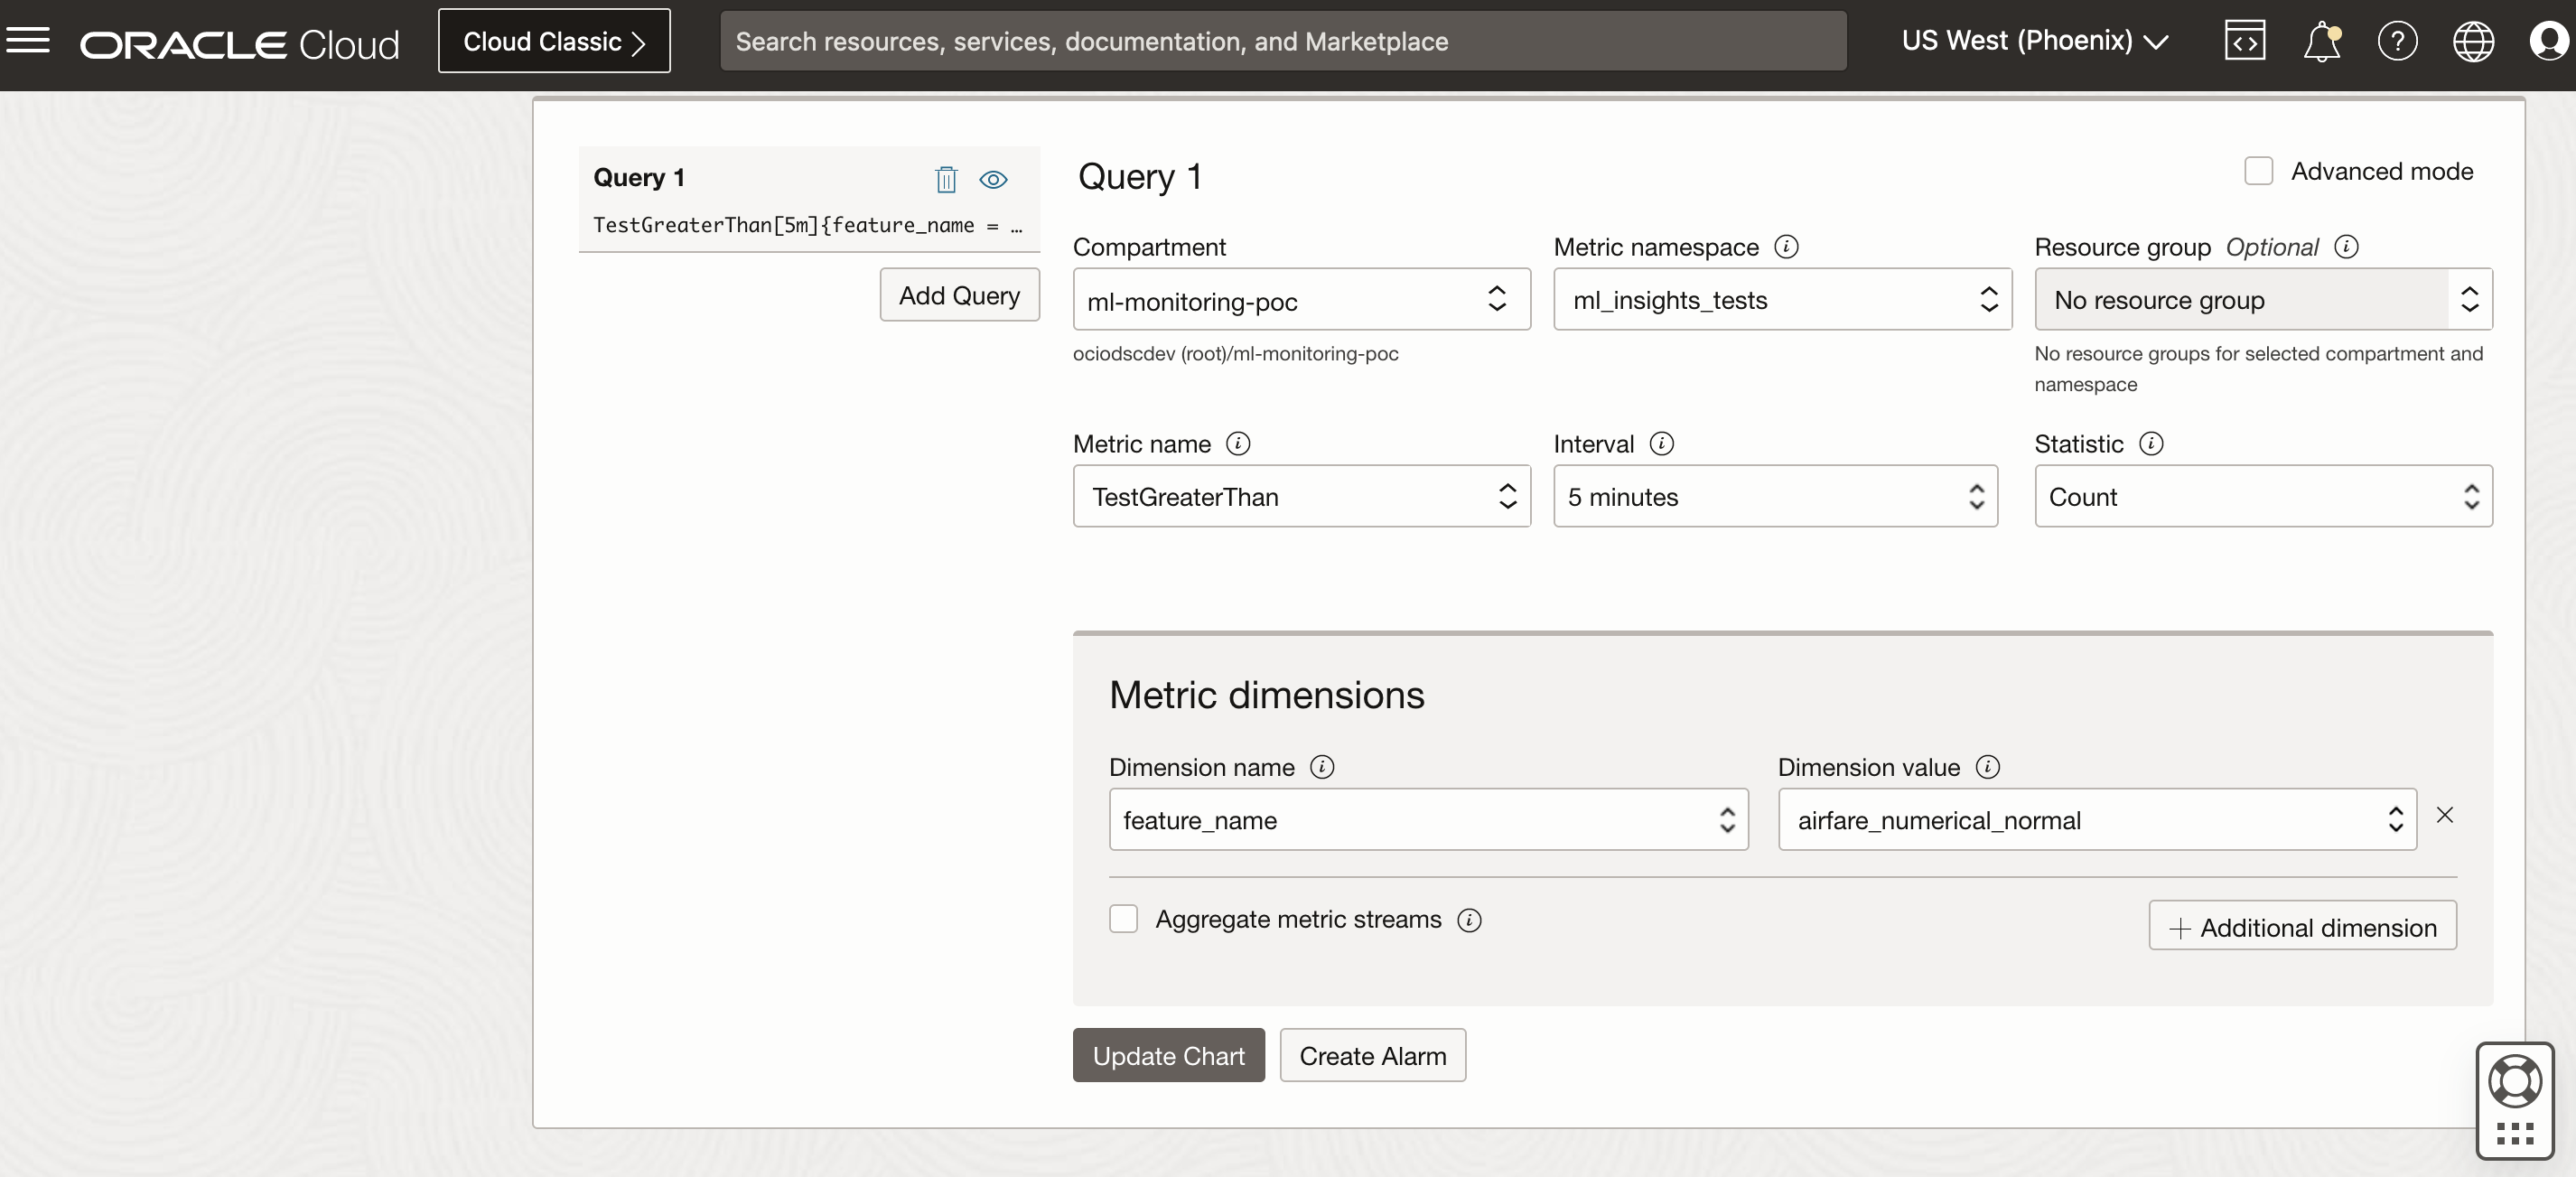
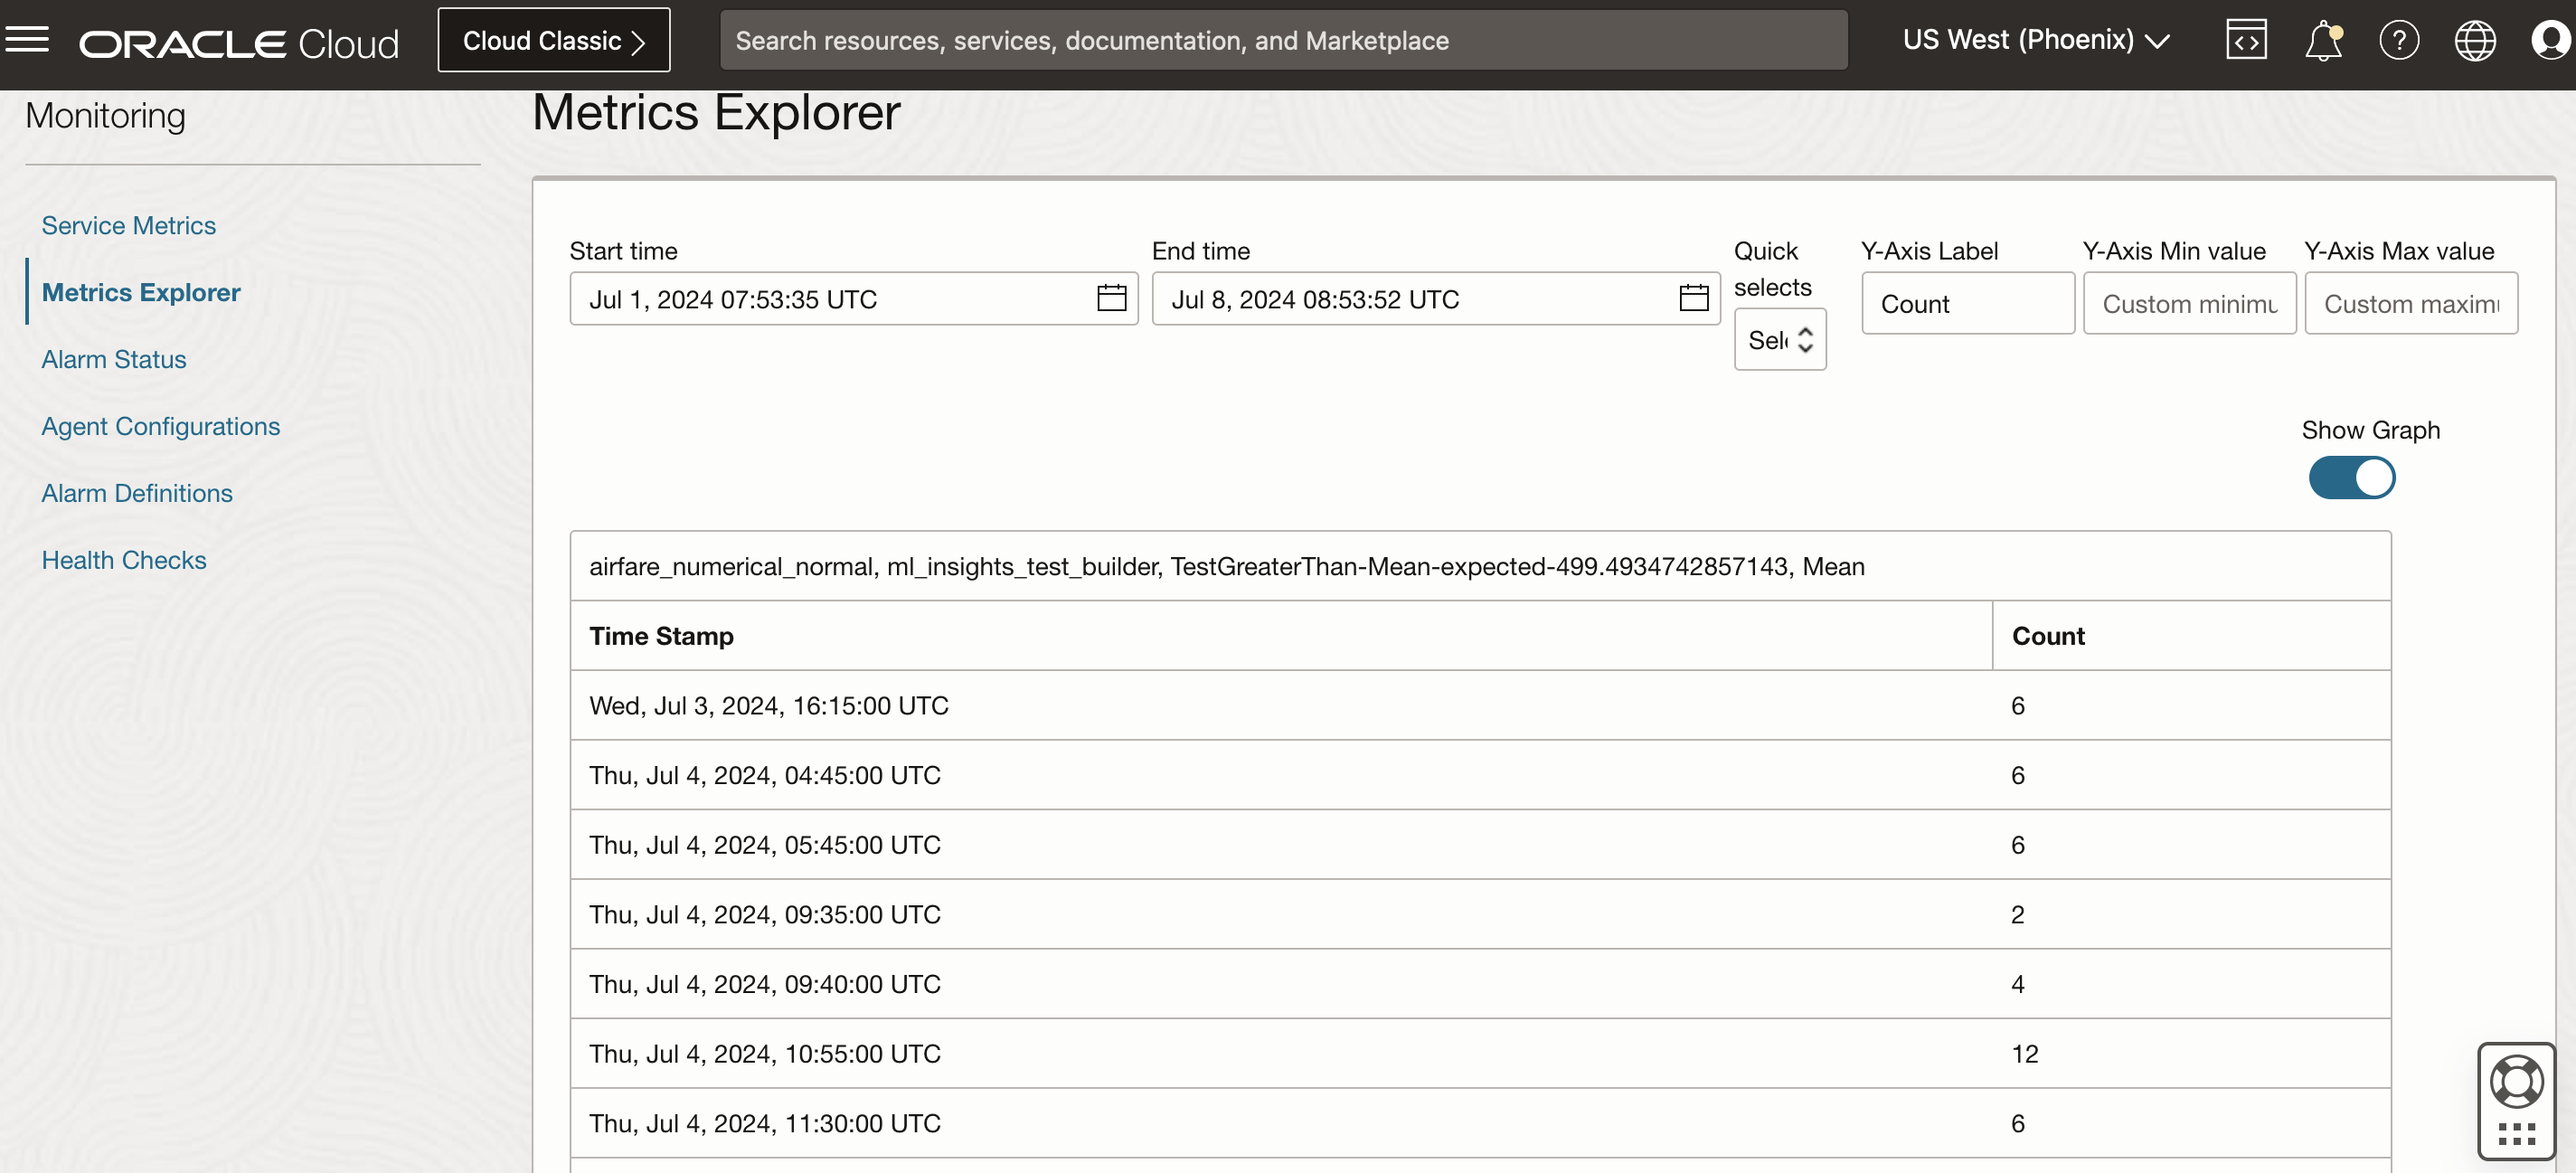
The results corresponding to the above query can be visualized as a data table or graph over a specified duration.
Configure Alarms using OCI Monitoring
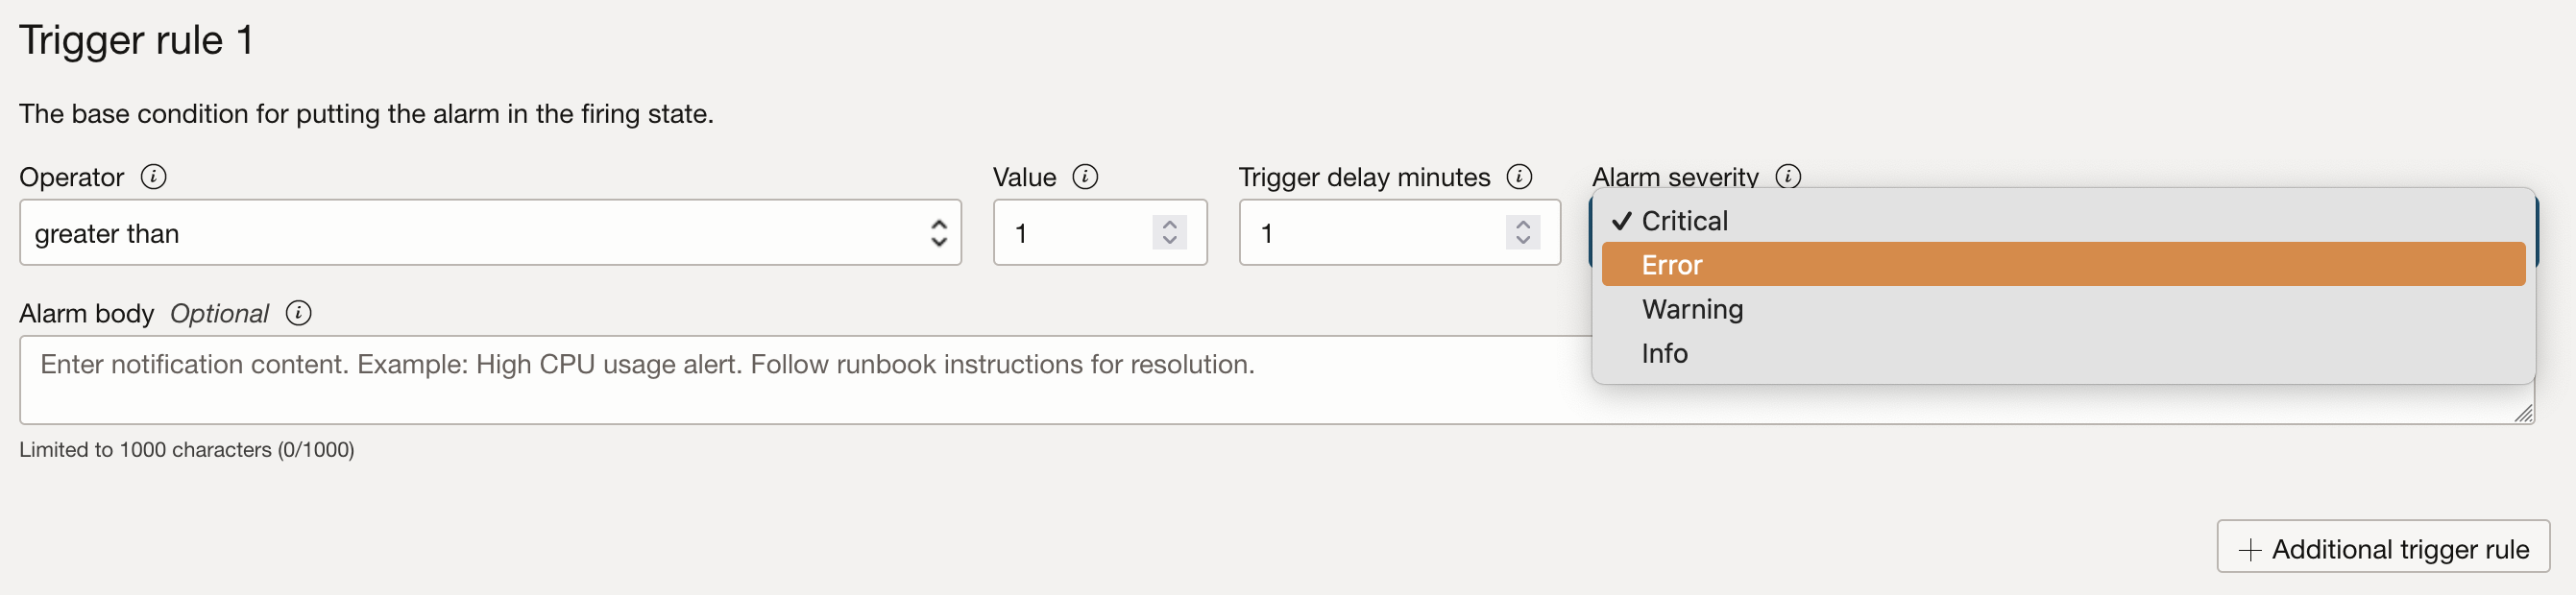
The query specified in the Metric Explorer section can be used to configure alarms via the Create Alarm option as shown here.
Alarm configuration details are captured comprehensively here: https://docs.oracle.com/en-us/iaas/Content/Monitoring/Tasks/managingalarms.htm
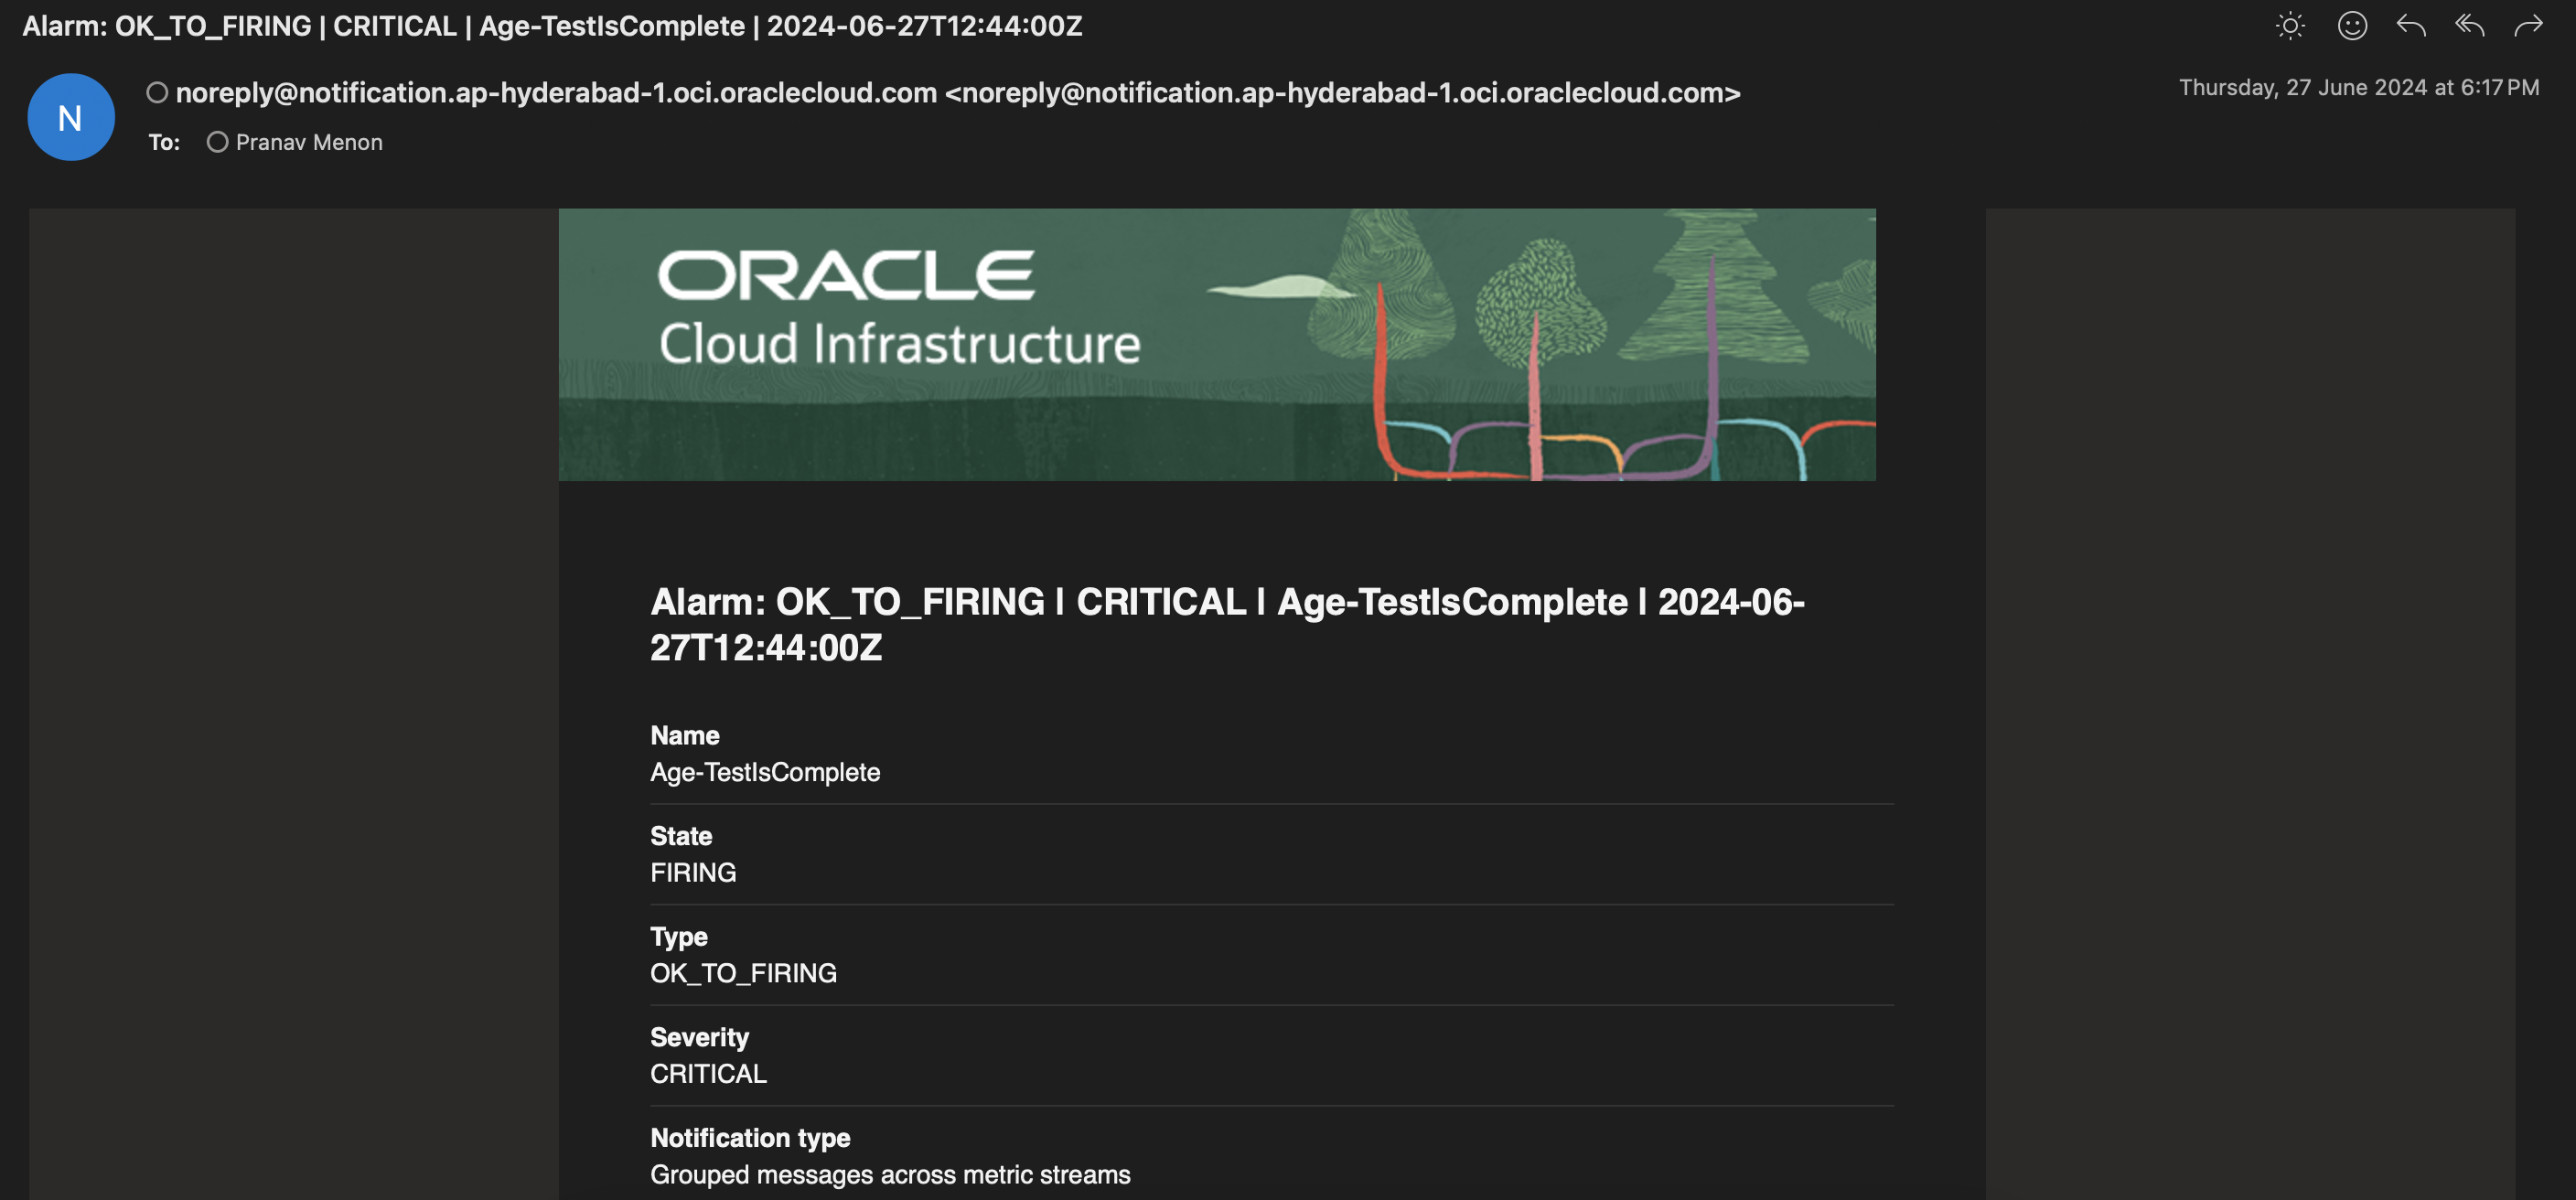
When configuring alarms, specify a trigger rule to cause the alarm to fire, along with a corresponding severity.
- The alarm notifications can be specified by creating a Topic (as described here), which allows users to configure a subscription protocol (like Email, Slack. or SMS), and the format of the notification received.
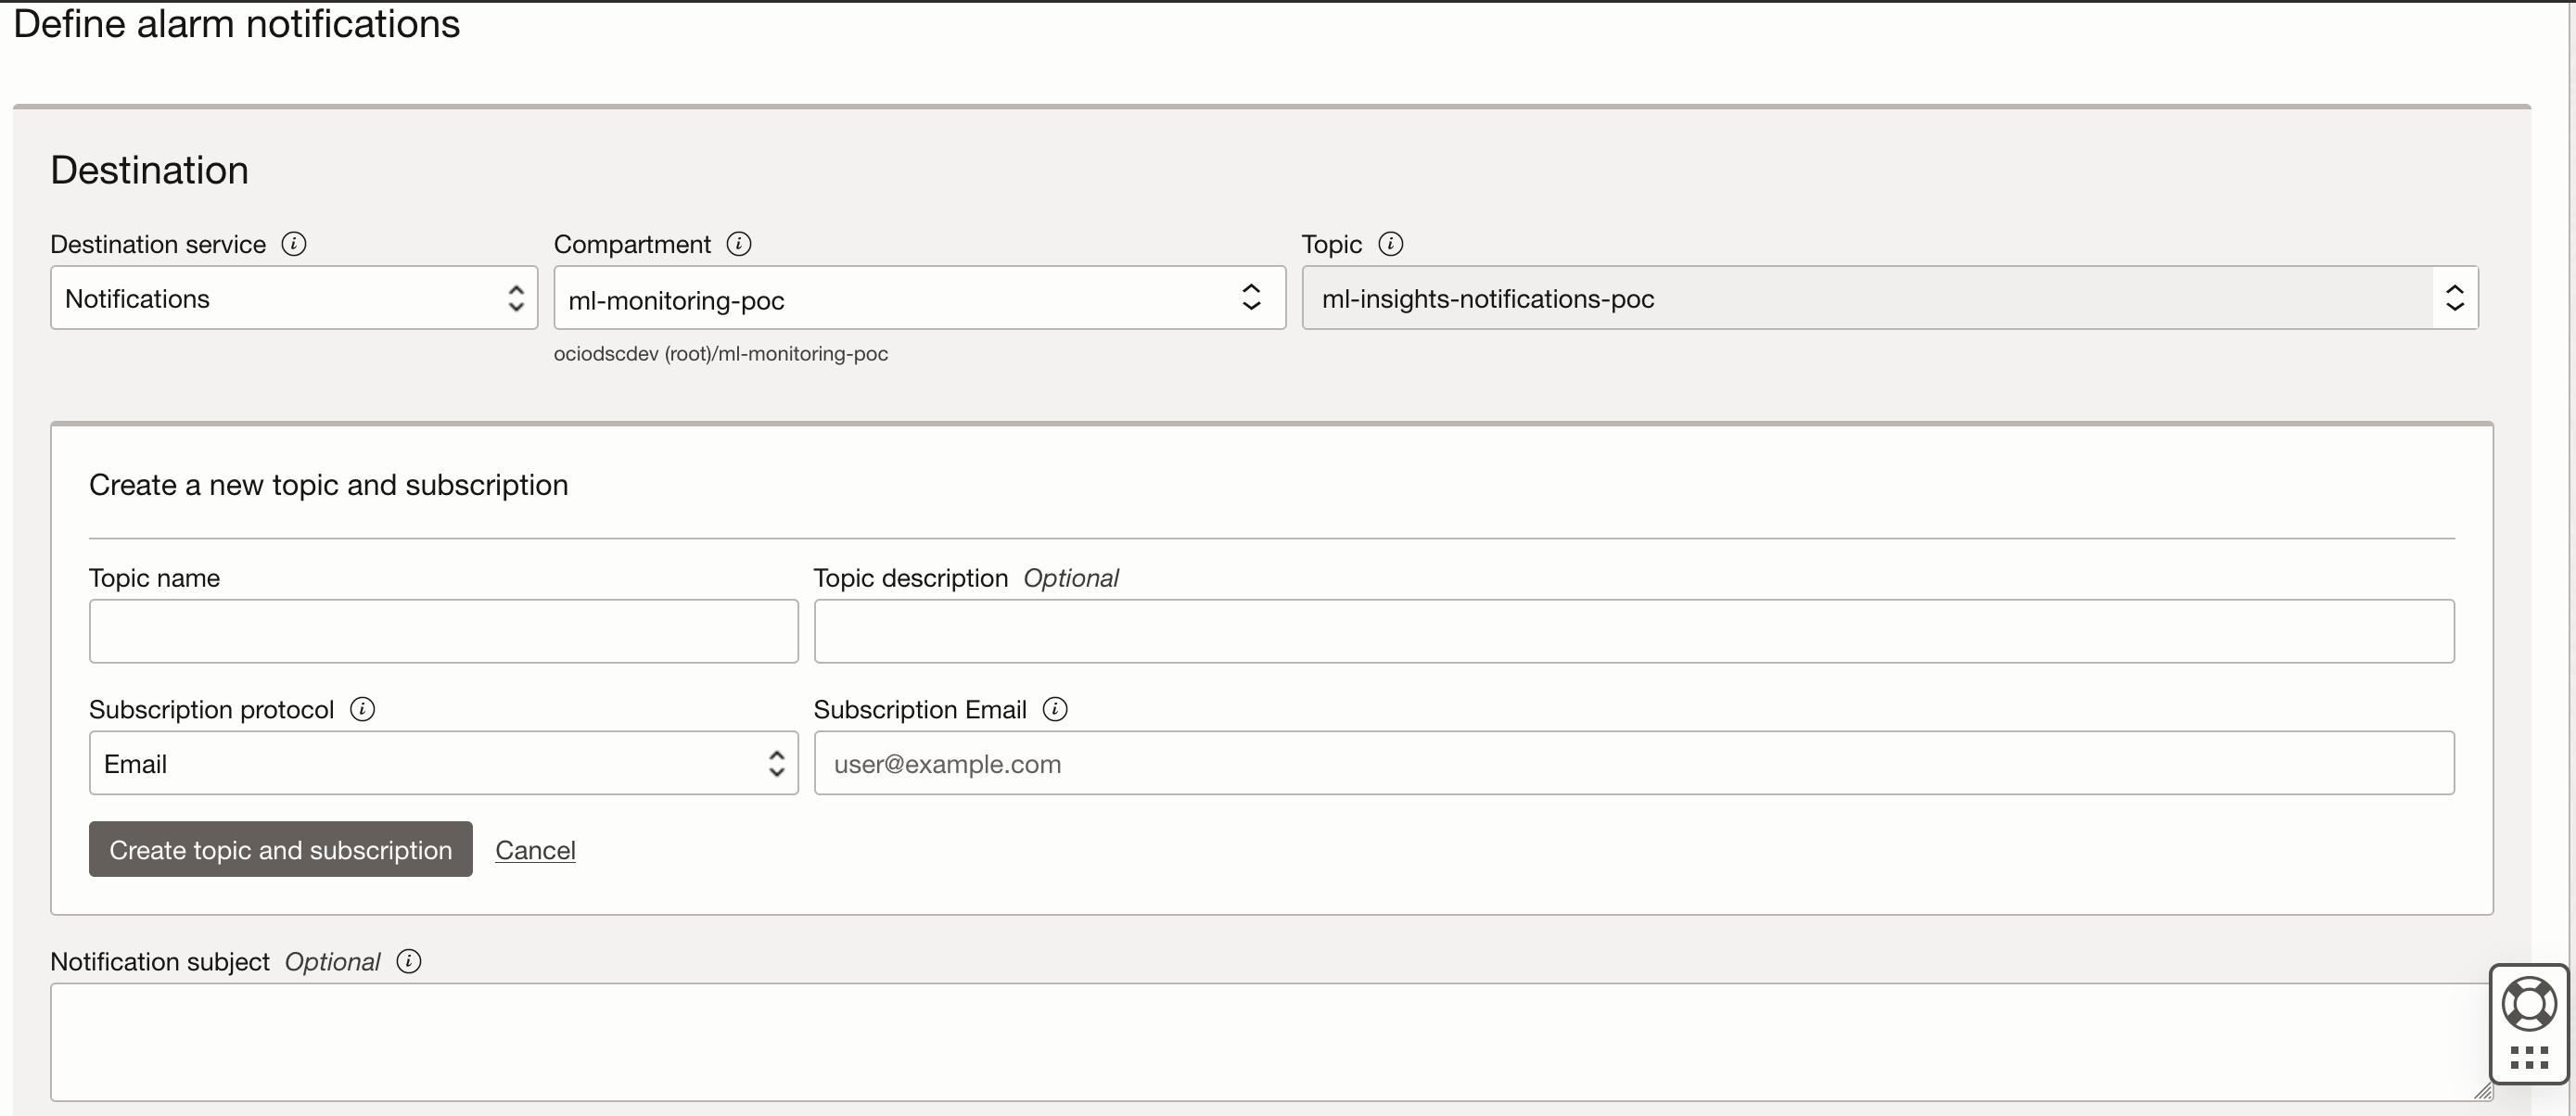
For example, creating a topic with an Email subscription protocol requires the user to specify a subscription email to which notifications on threshold breaches will be received. On creating the alarm, the user will be notified via email to subscribe to the topic, followed by receiving an email notification whenever a breach is observed.