VNIC Metrics
Learn about available Monitoring metrics for virtual network interface cards in a virtual cloud network.
You can monitor the health, capacity, and performance of your Networking service virtual network interface cards (VNICs) using metrics, alarms, and notifications.
This topic describes the metrics emitted by the metric namespace oci_vcn (the Networking service).
Resources: virtual network interface cards (VNICs).
Overview of Metrics for an Instance and Its Network Devices
For an overview of the metrics available for an instance and its storage and network devices, see Compute Instance Metrics.
Overview of Metrics: oci_vcn
Each compute instance has one or more Networking service VNICs. A VNIC connects the instance to a subnet in a Virtual Cloud Network (VCN). Each VNIC controls how the instance communicates with endpoints inside the VCN (other instances) and endpoints outside the VCN (hosts on the internet, in your on-premises network, in another VCN, and so on).
With the Networking service metrics (in metric namespace
oci_vcn), you can get the following information for a VNIC:
- Traffic to and from the network: Per-VNIC traffic levels (packets and bytes), which can help you identify meaningful increases or decreases in traffic to and from your instances
- Packets dropped due to security list violations: Per-VNIC drops (dropped packets), which can help you identify changes in traffic caused by security list changes
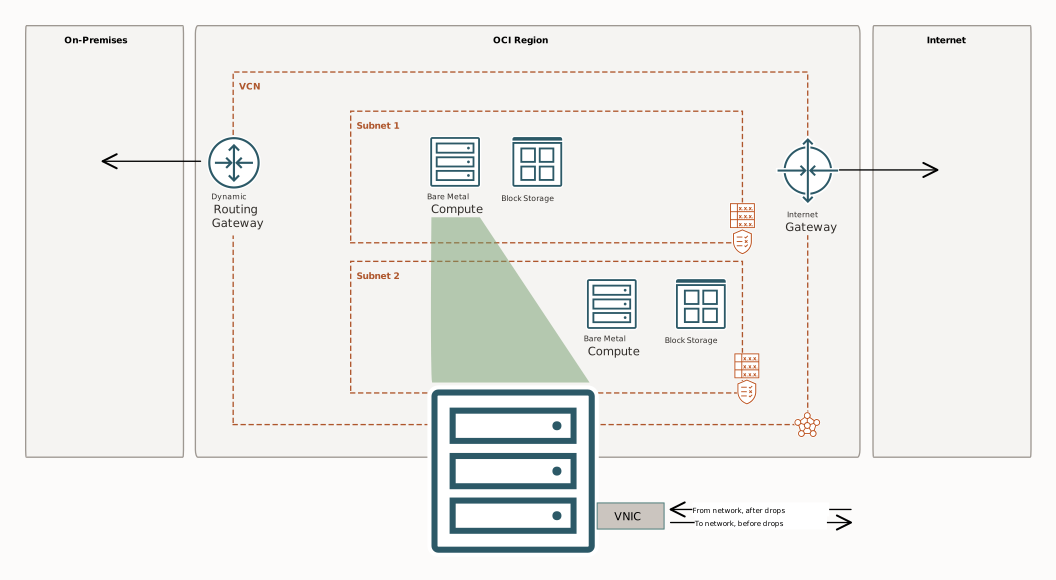
The following diagram shows an instance in a subnet within a VCN that has one or more gateways for communication with other networks. The instance is enlarged to show its VNIC, which the instance uses to communicate with the network. In this context, the term network means both the other instances in the VCN and hosts outside the VCN available through the gateways.
The VNIC receives traffic from the network and sends traffic to the network. The Networking service drops packets according to security list rules you set up for the instance's subnet. Traffic coming to the VNIC from the network is measured after the Networking service drops the packets that violate the subnet's security list rules. Traffic leaving the VNIC is measured before the Networking service drops the packets that violate the subnet's security list rules.
The Compute service separately reports network-related metrics as measured on the instance itself and aggregated across all the attached VNICs. Those metrics are available in the oci_computeagent metric namespace. For more information, see Compute Instance Metrics.
Raw Data Point Frequency
For every 1-minute interval, the Networking service posts one raw data point to the Monitoring service. The Monitoring service charts show data points at 1-minute, 5-minute, 1-hour (60-minute), and 1-day intervals. Supported values for interval depend on the specified time range in the metric query (not applicable to alarm queries). More interval values are supported for smaller time ranges. For example, if you select one hour for the time range, then all interval values are supported. If you select 90 days for the time range, then only interval values between 1 hour and 1 day are supported. The available statistics are calculated by using the count of 1-minute data points in the selected interval. For example, for a particular metric:
- The mean for each 5-minute interval is calculated over five raw data points.
- The mean for each 60-minute interval is calculated over 60 raw data points.
Required IAM Policy
When writing an IAM policy for viewing VNIC metrics, consider the following compartment locations:
- The VNIC and the VNIC's metrics (emitted by the
oci_vcnmetric namespace) reside in the subnet's compartment, and not the instance's compartment. - The VNIC attachment (a separate object from the VNIC itself) resides in the instance's compartment.
If the instance and subnet are in the same compartment, these details aren't so important when you write the IAM policy.
The following policy contains the single statement required to get VNIC metrics, which are part of the oci_vcn metric namespace.
If you're using the Console, this policy lets you open the Monitoring tab in the Console and view the metrics for one or more VNICs in the specified compartment. The policy uses an example group called VnicMetricReaders. The condition at the end (where target.metrics.namespace='oci_vcn') allows the group to view only the metrics in the oci_vcn metric namespace.
Allow group VnicMetricReaders to read metrics in compartment <subnet_compartment> where target.metrics.namespace='oci_vcn'The following policy lets you view an instance in the Console, open a specific VNIC, and view its details and metrics.
Allow group VnicMetricReaders to read metrics in compartment <subnet_compartment> where target.metrics.namespace='oci_vcn'
Allow group VnicMetricReaders to read instance-family in compartment <instance_compartment>
Allow group VnicMetricReaders to inspect virtual-network-family in compartment <subnet_compartment>
The second and third statements let you view the instance's details and the VNIC's details, respectively.
Available Metrics: oci_vcn
The Vnic metrics listed in the following table are automatically available for any VNIC on any instance you create. You don't need to enable monitoring on the instance to get these metrics for its VNICs.
You can also use the Monitoring service to create custom queries. See Building Metric Queries.
Each metric includes the following dimension:
- RESOURCEID
- The OCID of the VNIC.
| Metric | Metric Display Name | Unit | Description | Dimensions |
|---|---|---|---|---|
VnicEgressDropsSecurityList
|
Egress Packets Dropped by Security List |
packets |
Packets sent by the VNIC to the network that are dropped because of security rule violations. |
resourceId |
VnicIngressDropsSecurityList
|
Ingress Packets Dropped by Security List |
packets |
Packets received from the network for the VNIC that are dropped because of security rule violations. |
resourceId |
VnicFromNetworkBytes* |
Bytes from Network |
bytes |
Bytes received at the VNIC from the network, after drops. |
resourceId |
VnicFromNetworkPackets* |
Packets from Network |
packets |
Packets received at the VNIC from the network, after drops. |
resourceId |
VnicToNetworkBytes* |
Bytes to Network |
bytes |
Bytes sent from the VNIC to the network, before drops. |
resourceId |
VnicToNetworkPackets* |
Packets to Network |
packets |
Packets sent from the VNIC to the network, before drops. |
resourceId |
VnicIngressDropsThrottle
|
Throttled Ingress Packets | packets |
Packets received from the network for the VNIC that are dropped because of throttling. |
resourceId |
VnicEgressDropsThrottle
|
Throttled Egress Packets | packets |
Packets sent from the VNIC to the network that are dropped because of throttling. |
resourceId |
VnicIngressDropsConntrackFull
|
Ingress Packets Dropped by Full Connection Tracking Table | packets |
Packets received from the network for the VNIC that are dropped because the connection tracking table is full. |
resourceId |
VnicEgressDropsConntrackFull
|
Egress Packets Dropped by Full Connection Tracking Table | packets |
Packets sent from the VNIC to the network that are dropped because the connection tracking table is full. |
resourceId |
VnicConntrackUtilPercent
|
Connection Tracking Table Utilization | percentage |
Total utilization percentage (0–100%) of the connection tracking table. |
resourceId , instanceId |
VnicConntrackIsFull |
Connection Tracking Table Full | boolean |
Boolean (0/false, 1/true) that indicates the connection tracking table is full. |
resourceId |
VnicIngressDropsZpr |
Ingress Packets Dropped by ZPR | packets | Number of packets dropped in SmartNIC from network because of ZPR policy check failure | resourceId |
VnicEgressDropsZpr |
Egress Packets Dropped by ZPR | packets | Number of packets dropped in SmartNIC to network because of ZPR policy check failure | resourceId |
VnicIngressMirrorDropsZpr |
Ingress Mirrored Packets Dropped by ZPR | packets | Number of received VTAP packets dropped in SmartNIC from network. | resourceId |
SmartnicBufferDropsFromNetwork ** |
Smartnic Buffer Drops from Network | packets | Number of packets from the network dropped in SmartNIC because of buffer exhaustion. | resourceId |
SmartnicBufferDropsFromHost ** |
Smartnic Buffer Drops from Host | packets | Number of packets from the host dropped in SmartNIC because of buffer exhaustion. | resourceId |
* The Compute service separately reports network-related metrics as measured on the instance itself and aggregated across all the attached VNICs. Those metrics are available in the oci_computeagent metric namespace. For more information, see Compute Instance Metrics.
** The SmartnicBufferDropsFromNetwork and SmartnicBufferDropsFromHost metrics are available only for bare metal instances. For VMs, these metric values aren't emitted.
Tips for Working with VNIC Metrics
Here are some tips to help you use VNIC metrics.
Default Metric Charts for One VNIC Compared to Several VNICs
The default charts for VNIC metrics use the following settings:
- Time range = the last hour
- Interval = 1 minute
- Statistic displayed: Sum
- Aggregation of metric streams = not selected (which means each VNIC is displayed as a separate line on the chart)
You can view the default charts with data for only a single VNIC by viewing the VNIC's details in the Console. For a single VNIC, the most useful statistics are sum, mean, max, and min.
You can view the default charts with data for multiple VNICs
by going to
the Service Metrics page in the Console.
Select the necessary compartment and metric namespace (oci_vcn) at
the top of the page. For all the charts, you can either show each VNIC as a separate
line, or show a single line that aggregates the data for all the VNICs in your
selected compartment. To aggregate the data, select Aggregate Metric
Streams.
When viewing aggregated data, you can use the P90 - P99.9 statistics to help identify typical behavior of your instance fleet and outliers. To view these statistics over an even larger number of data points, expand the chart's time range (for example, view the last 7 days instead of the last hour), and set the interval to 1 hour.
For information about using and modifying the default metric charts, see Viewing Default Metric Charts.
Alarms for VNIC Metrics
You can set up alarms for a particular metric. For VNICs, an alarm is most useful for the egress security list drops metric (VnicEgressDropsSecurityList). Normally, you shouldn't have egress security list drops. If you do, it might be due to one of the following causes:
- An application is acting unexpectedly
- Your security list is incorrectly configured
In either case, an alarm is warranted.
Using the Console
- Open the navigation menu and select Compute. Under Compute, select Instances.
- Select the instance to view its details.
- Select Attached VNICs.
- Select the VNIC to view its details.
- Select Metrics.
For more information about monitoring metrics and using alarms, see Overview of Monitoring. For information about notifications for alarms, see Overview of Notifications.
- Open the navigation menu and select Observability & Management. Under Monitoring, select Service Metrics.
- Select the compartment that contains the VNICs you want to monitor. Each VNIC resides in its subnet's compartment.
-
For Metric namespace, select "oci_vcn."
The Service Metrics page updates to show charts for each metric emitted by the selected metric namespace.
If the compartment has several VNICs, the charts default to show a separate line for each VNIC. By selecting Aggregate Metric Streams, you can show a single line aggregated across all the VNICs.
For more information about monitoring metrics and using alarms, see Overview of Monitoring. For information about notifications for alarms, see Overview of Notifications.
Using the API
- Monitoring API for metrics and alarms
- Notifications API for notifications (used with alarms)