Customize the Alarm Body
You can write alarm body in the alarm definition by using those dynamic variables from the metric data which triggered the alarm.
For details and steps to customize the alarm body, see the step Alarm Summary in Creating a Basic Alarm.
Example: Create URL in the Alarm Body to View the Alarm Triggering Log Records in Log Explorer
You might want to have a meaningful URL in the alarm body to get back to the Log Explorer to see the log records that fired the alarm. To do this, pass a time range, and some additional filters. Typically, in this flow, you would pass the label name. Additionally, in the following example, we will also pass the entity (mtgt).
- Detection Rule Definition:
Consider the ingest-time detection rule which has the following configuration:
- Detection rule name:
http errors - The detection rule triggers when it finds at least one log
record in a one-minute period that has been assigned the label
HTTP Error. The assignment of this label is done in the enrichment configuration automatically when the data is ingested. - When there is at least 1 matching log record in a one-minute
period, a metric
http_errorsin the namespacelogging_analytics_testgets a new value. - The dimensions are added based on parsed log fields Entity and Host IP Address (Client).
- Additionally, the dimensions are automatically added for
the label (
HTTP Errorin this case), and the detection rule OCID. Those are implicit dimensions.
- Detection rule name:
- View the metrics generated by detection rule in the Metrics
Explorer:

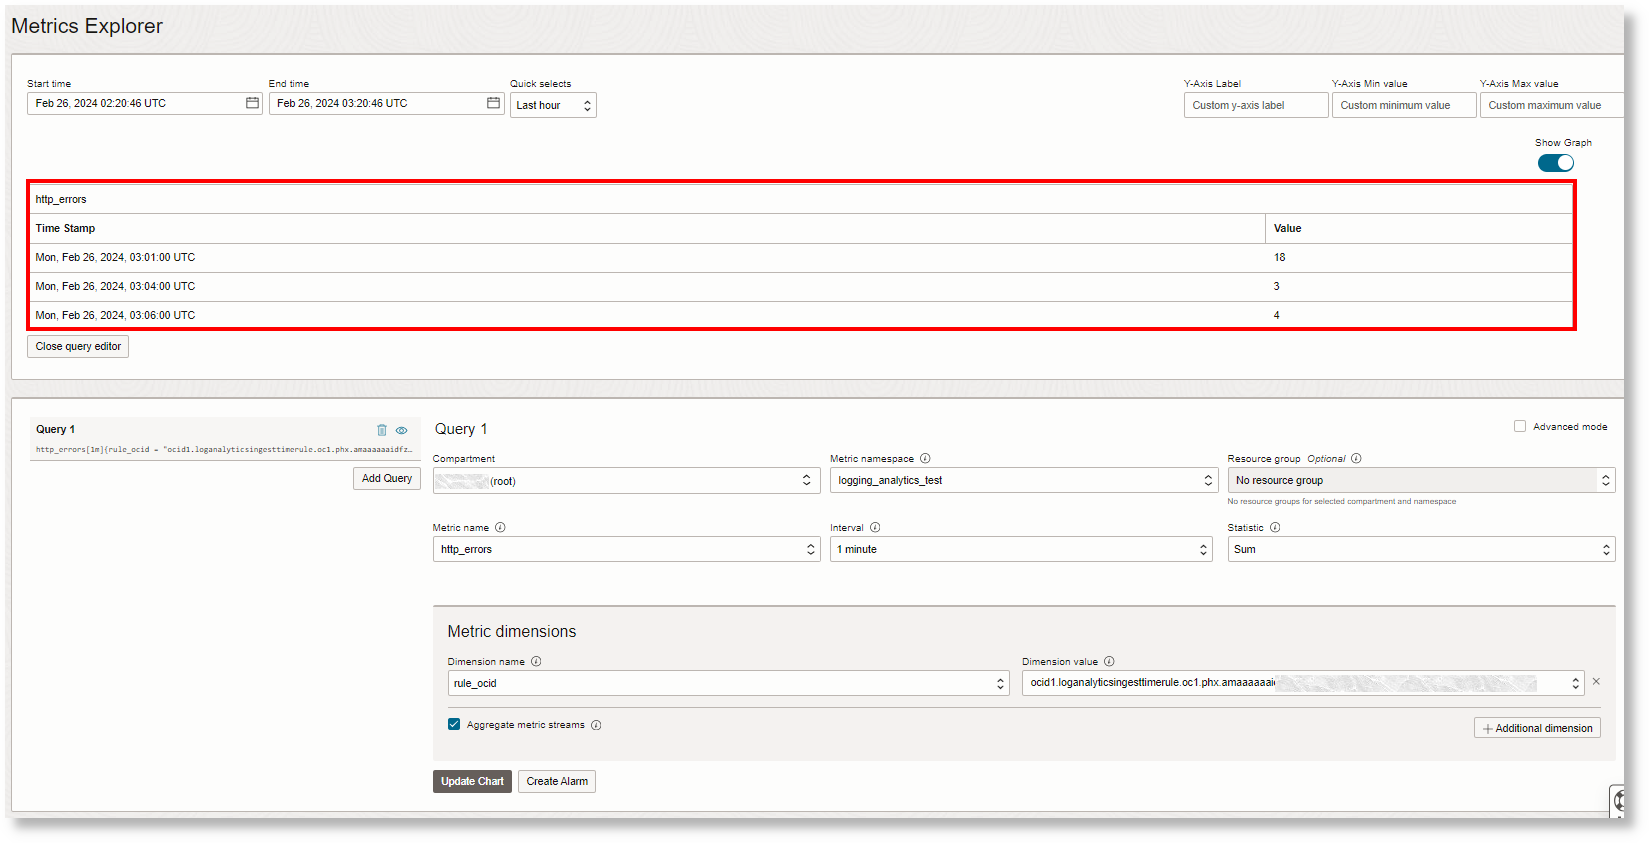
When looking at the metrics explorer for the http errors metric, the following information can be noted:
Coinciding with the Log Explorer, three data points with
18,3, and4log records match this label.The following dimensions are displayed. Note that
Host IP Address (Client)is not displayed because the log records triggering the alarms didn't have a value for that field.
- Customize alarm body:
For the log records that triggered the alarm, here are the values of the dimensions:

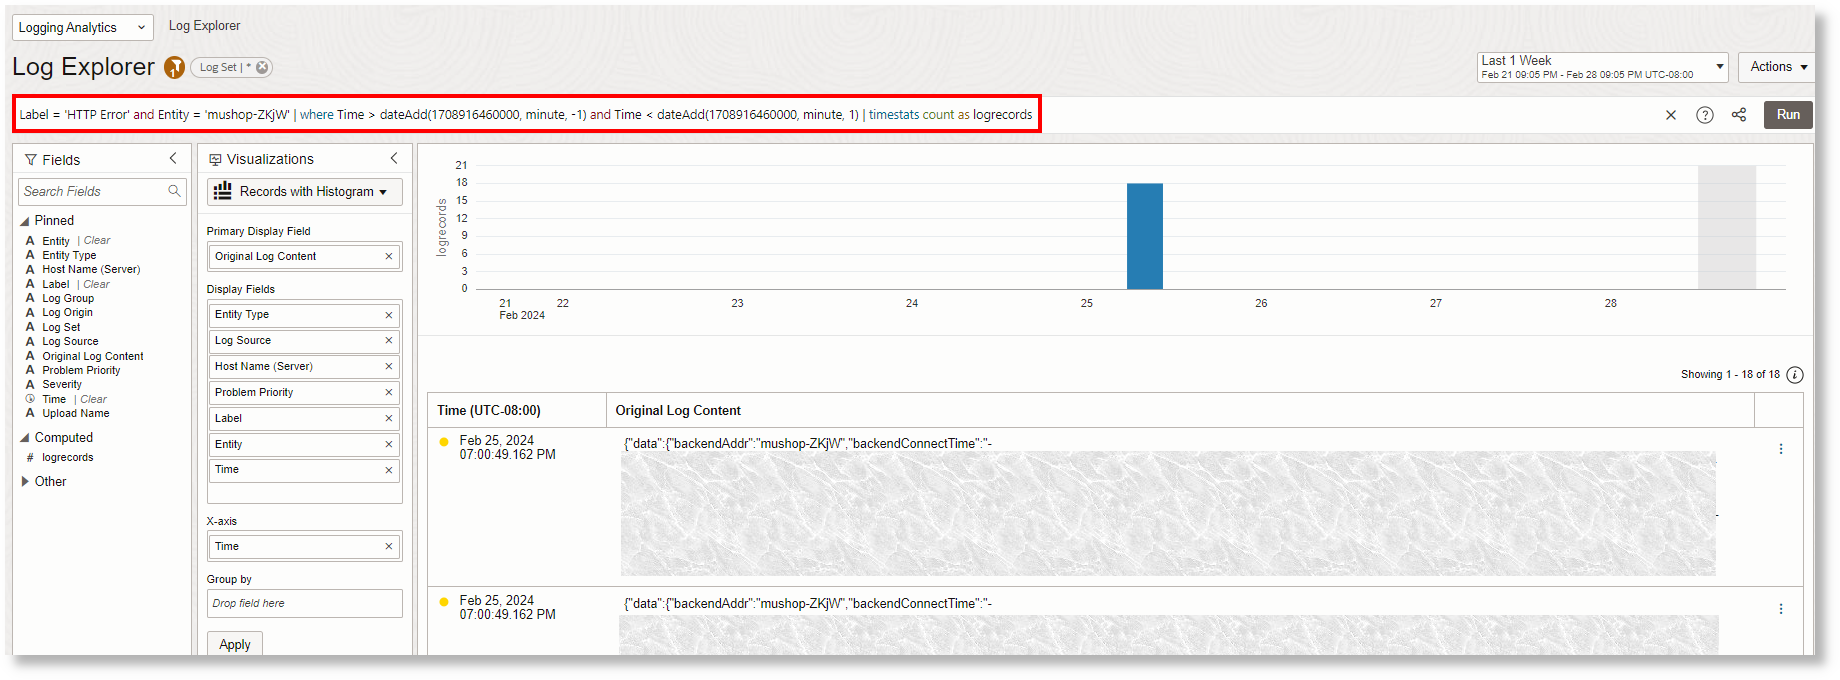
Running the following query takes you back to the Log Explorer in context; for example, when the alarm is triggered on 18 matching log records (the first data point in the Metric Explorer):
Label = 'HTTP Error' and Entity='mushop-ZKjW' | where Time > dateAdd(1708916460000, minute, -1) and Time < dateAdd(1708916460000, minute, 1) | timestats count as logrecordsHere the values
HTTP Error,mushop-ZKjW, and1708916460000come from the alarm variables. In the query, we look for the time one minute before and after the alarm time. You can adjust this in the query.Here is an example alarm body content that gives you a link in your email to get back to this view:
This alarm indicates that one or more HTTP Errors have occurred. You can see the original log records here:
https://cloud.oracle.com/loganalytics/explorer?region=us-phoenix-1&timeNum=1&timeUnit=week&filters=label__:__{{Dimensions.Label}}__;__entity__:__{{Dimensions.mtgt}}&query=* | where time > dateadd({{timestampEpochMillis}}, minute, -1) and time < dateadd{{timestampEpochMillis}}, minute, 1) | timestats count as logrecords
Before the alarm notification is generated, the variables in
{{}}are replaced by the Monitoring service by giving a resulting alarm body text:This alarm indicates that one or more HTTP Errors have occurred. You can see the original log records here: https://cloud.oracle.com/loganalytics/explorer?region=us-phoenix-1&timeNum=1&timeUnit=week&filters=label__:__HTTP Error__;__entity__:__mushop-ZKjW&query=* | where time > dateadd(1708916460000 , minute, -1) and time < dateadd(1708916460000, minute, 1) | timestats count as logrecords - View result in the Log Explorer:
When you click the link in your email, and after you log into your tenancy, the following is displayed:

For the details about Log Explorer URL parameters, see Log Explorer URL Parameters.